Discover
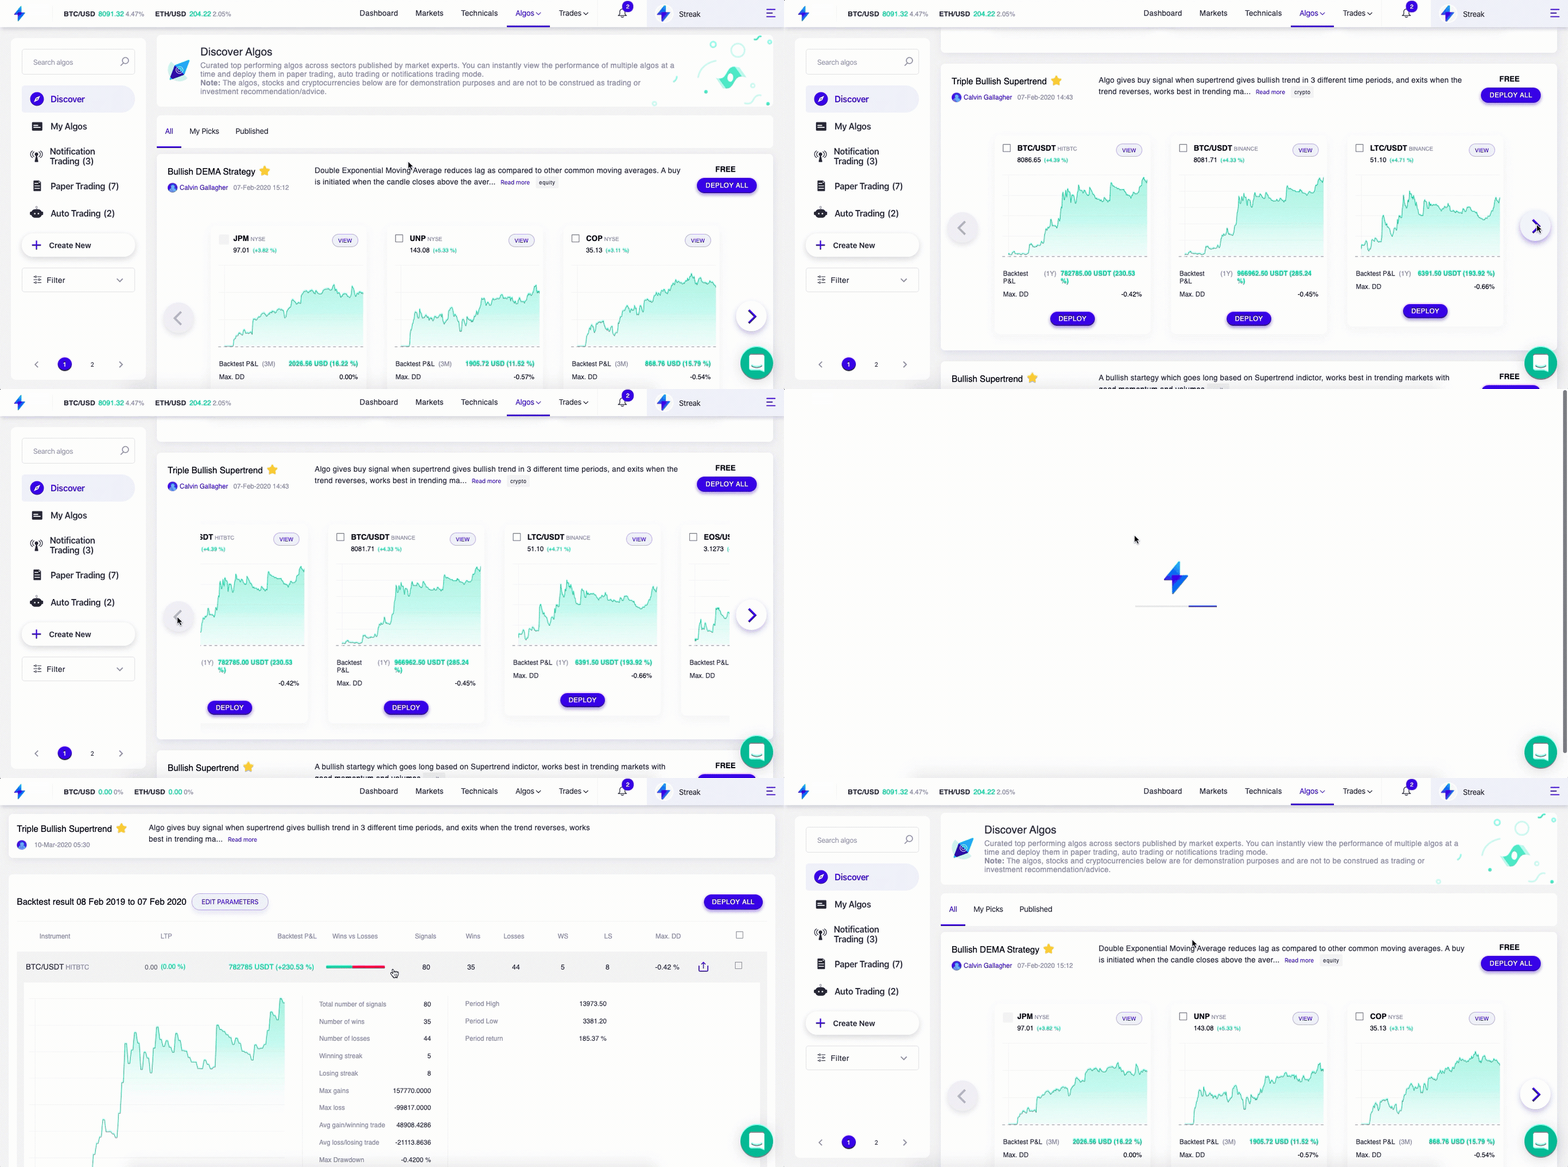
Discover allows users to access numerous backtested sample algos to get started with. You can view the performance of curated top-performing algos across sectors and also deploy them instantly.

Using the new search and filter feature, you can filter algos based on position, chart type, and indicators. Whether you want algos based on overlay studies, momentum, volume and volatility, price action or chart patterns, you can use the filters to find the choice of your algo in a minute.
Overlays: Overlay studies are displayed over the main price chart and include the following indicators- Moving averages(SMA, EMA, DEMA, TEMA, WMA, TMA), Bollinger Bands, Parabolic SAR, Supertrend, VWAP, alligator, and Ichimoku.
Momentum: Momentum can be defined as acceleration or deceleration of the rate of change of price. Momentum indicators are useful for volatile market and include Relative Strength Index, ADX, Aroon, MACD, CCI, MFI, Willams %R, TRIX, PROC, MOM, Stochastic, TII and Chande Momentum Oscillator
More on Momentum
Example: The company's stock price changed from $2 in 2016 to $4 in 2017. The rate of price change increased from $4 in 2017 to $8 in 2018 and so forth.

Volume: These indicators account for volume data in their calculation and includes OBV, Volume, Opening Range Volume, and Moving Average Volume
Volatility: Volatility indicators measure how risky the current market is but does not determine a direction. In technical analysis, volatility is measured by True Range, Average True Range, Natr and vortex indicators.
More on volatility
Example: Stock of company X has annualized volatility of 20%. It means after a year the current price $100 can go up by 20% to $120 or come down by 20% to $80.

'a'represents the price line in case the stock goes up. Similarly, 'b' represents the price line in case the stock goes down.
Price action: Price action is the movement of a security's price plotted over time and is indicated by the following indicators Opening range, Close, Open, High, Low, Pivot, Narrow range, and Nth Candle.
Algo Snapshot
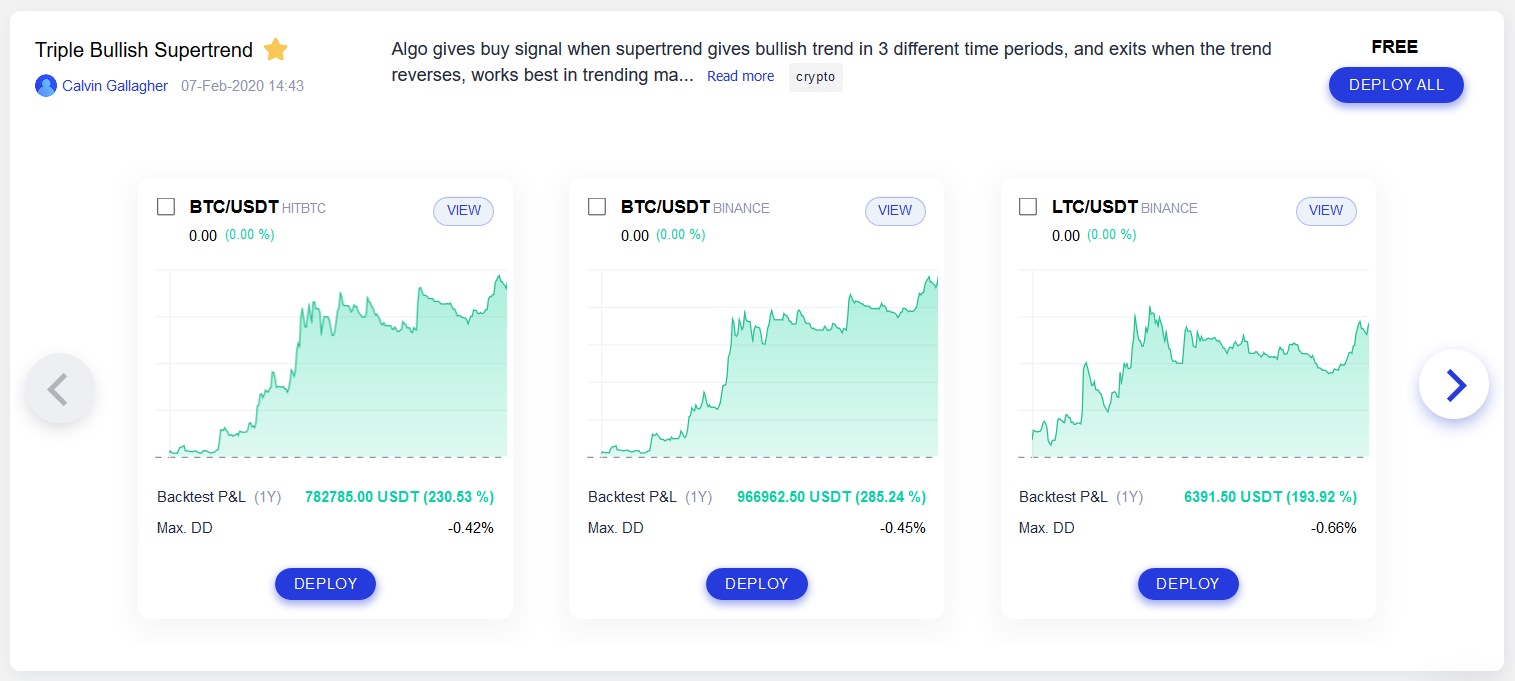
You can now view the performance of a algo on each instrument without opening the backtest result. This will enable you to go through all the major information about the algo quickly. You can also read the algo description to know more about the algo. We have also added a view counter to display how many people are tracking the backtest result of the algo.

Clicking on Deploy All would allow you to deploy the algo and all instruments listed in the screenshot immediately. In case you want to deploy a specific instrument, you can click on the small Deploy button. If you want to view the whole backtest result, you need to click on "View Backtest" and then click on Edit to personalize the algo as per your requirement.
The backtest result gets refreshed every single day to portray the performance in current market conditions and mentioned time frames.
Important
Please note that these algos are meant for inspiration and are not to be construed as recommendations. You can modify these algos anyway you like before taking it live.
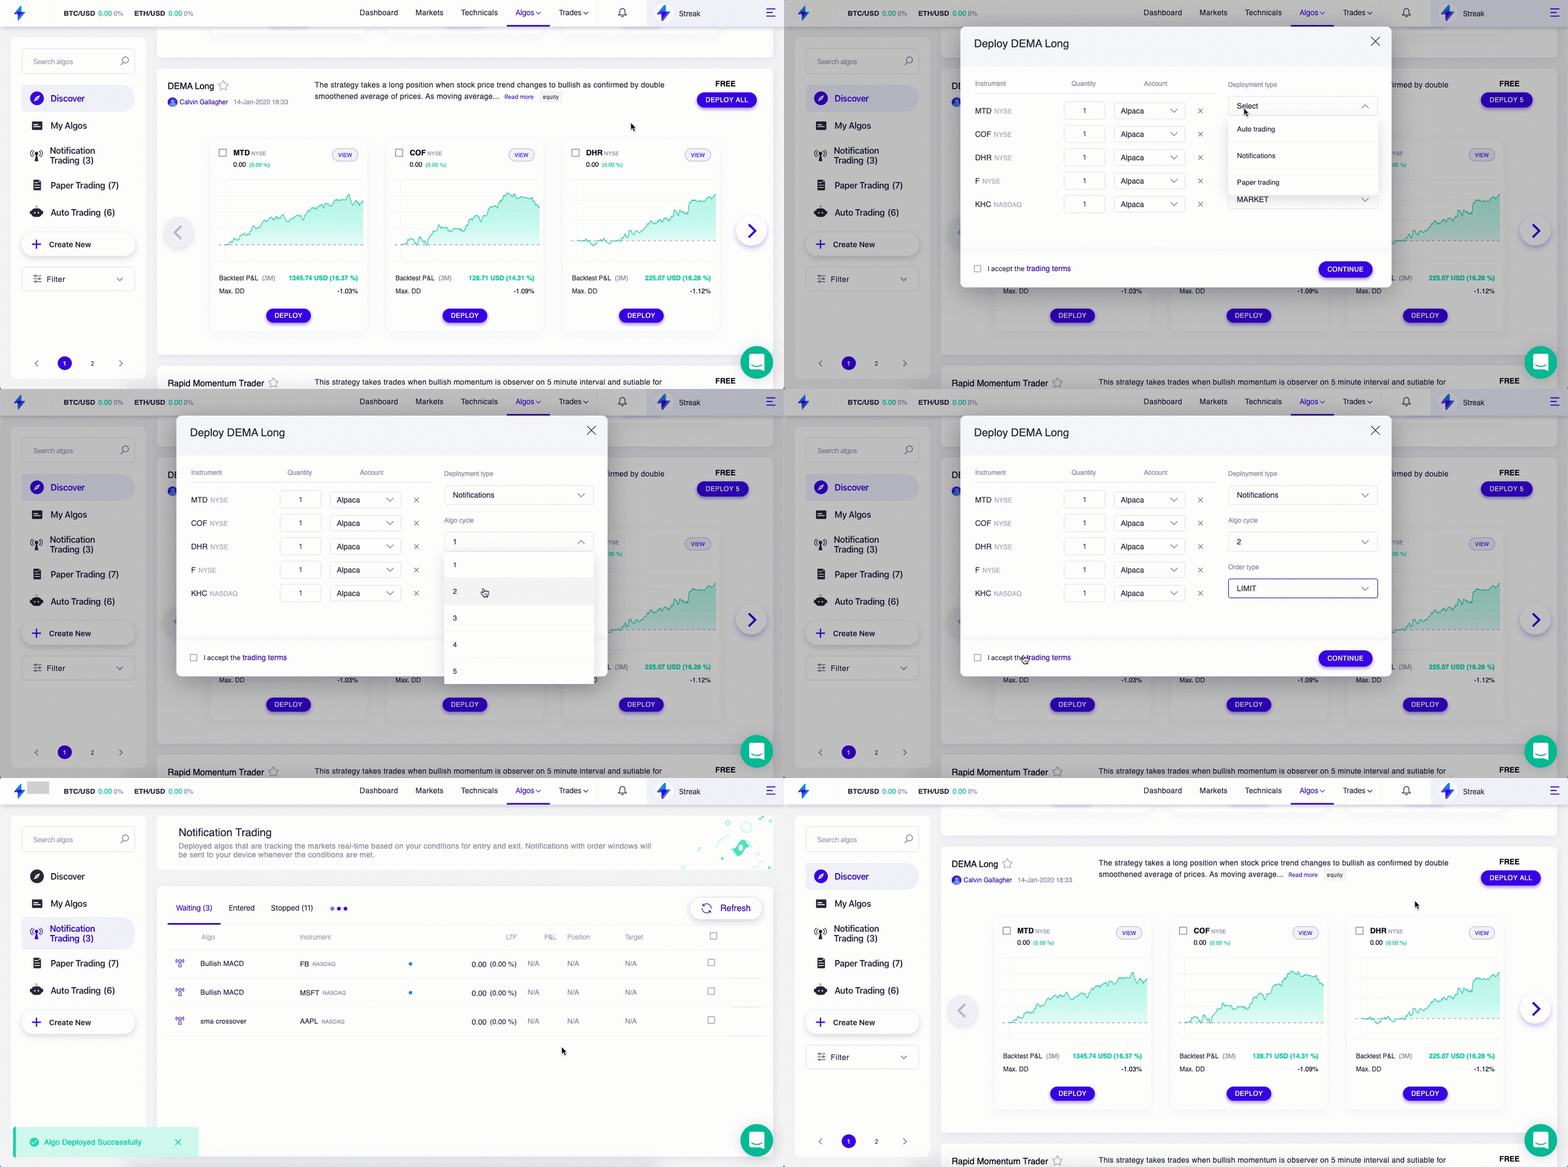
Deploying an algo from discover

To deploy an algo from discover, simply scroll to the algo of your choice and then click on the Deploy All button. You will see a deployment setting window will pop up. You need to then select the deployment and order type, set an algo cycle count. Then you have to accept the terms before clicking on the Continue button.