Charts
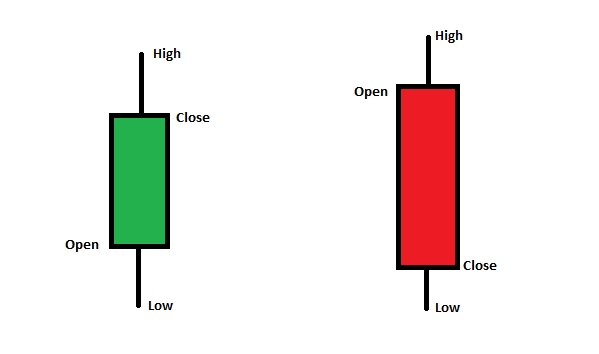
Candlestick chart
Japanese candlesticks have the potential of giving confirmation to signals generated by traditional (Western) technical analysis techniques.
Candlesticks are a complete approach to chart analysis that is sufficiently independent of Western techniques that value is added when they are combined. Moreover, since candlestick charts are created using the same information as Western bar charts (i.e., open, high, low, close), they can be smoothly related one to the other.
Heikin-Ashi chart
Heikin-Ashi Candlesticks are an offshoot from Japanese candlesticks. Heikin-Ashi Candlesticks use the open-close data from the prior period and the open-high-low-close data from the current period to create a combo candlestick. The resulting candlestick filters out some noise in an effort to better capture the trend. In Japanese, Heikin means “average” and ashi means “pace”. Taken together, Heikin-Ashi represents the average pace of prices.
Heikin-Ashi Candlesticks are not used like normal candlesticks. Dozens of bullish or bearish reversal patterns consisting of 1-3 candlesticks are not to be found. Instead, these candlesticks can be used to identify trending periods, potential reversal points and classic technical analysis patterns.Calculations
-
The Heikin-Ashi Close is simply an average of the open, high, low and close for the current period.
HA-Close = (Open(0) + High(0) + Low(0) + Close(0)) / 4 -
The Heikin-Ashi Open is the average of the prior Heikin-Ashi candlestick open plus the close of the prior Heikin-Ashi candlestick.
HA-Open = (HA-Open(-1) + HA-Close(-1)) / 2 -
The Heikin-Ashi High is the maximum of three data points: the current period's high, the current Heikin-Ashi candlestick open or the current Heikin-Ashi candlestick close.
HA-High = Maximum of the High(0), HA-Open(0) or HA-Close(0) -
The Heikin-Ashi low is the minimum of three data points: the current period's low, the current Heikin-Ashi candlestick open or the current Heikin-Ashi candlestick close.
HA-Low = Minimum of the Low(0), HA-Open(0) or HA-Close(0)
Heikin-Ashi Candlesticks are similar but different than normal candlesticks. While traditional candlestick patterns do not exist with Heikin-Ashi Candlesticks, chartists can derive valuable information from these charts.
A long hollow Heikin-Ashi candlestick shows strong buying pressure over a two day period. The absence of a lower shadow also reflects strength. A long filled Heikin-Ashi candlestick shows strong selling pressure over a two day period. The absence of an upper shadow also reflects selling pressure. Small Heikin-Ashi candlesticks or those with long upper and lower shadows show indecision over the last two days. This often occurs when the two normal candlesticks are of opposite color.